
AI observability
AI observability is request-level traces: prompt version, retrieval, tools, tokens, denies, and outcomes. A vendor usage graph is not observability.
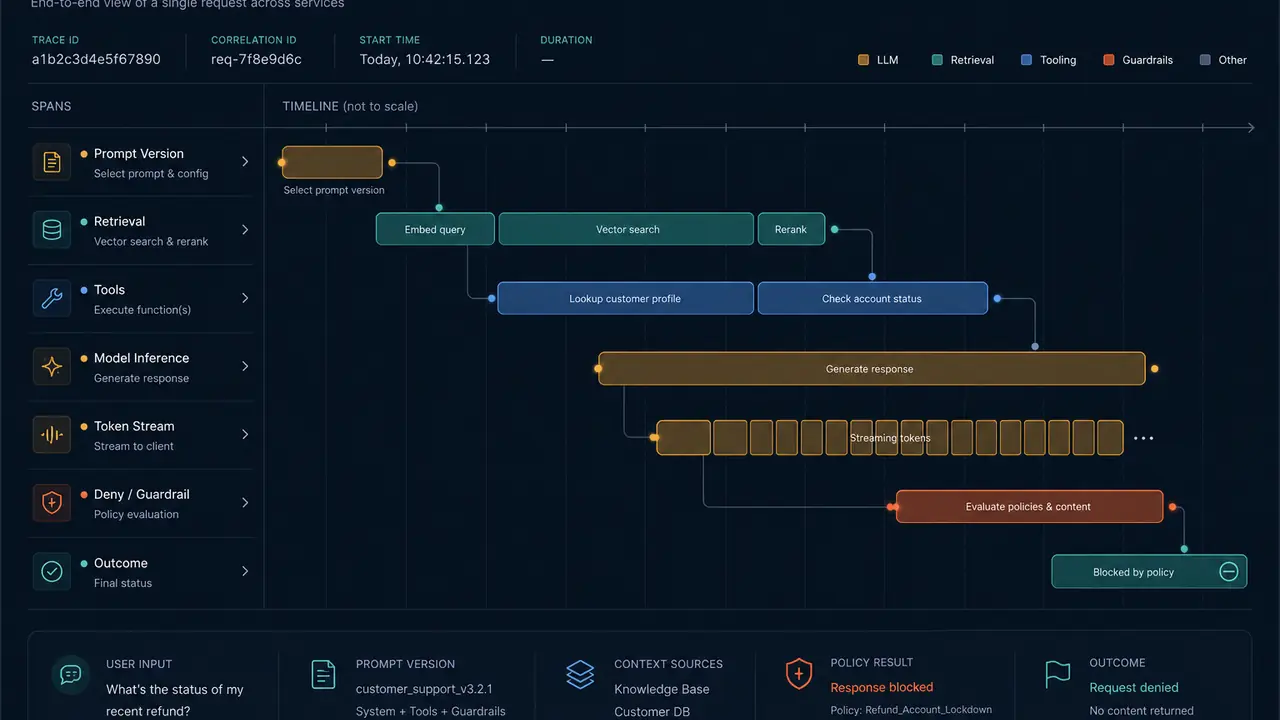
AI observability is the ability to reconstruct one request: who called, which prompt version, what was retrieved, which tools ran, whether policy denied, what it cost, and what the user did next. A vendor graph of tokens is not observability. It is a bill with a chart.
This sits on the gateway and on MCP the same way HTTP observability sits on the edge and the app. The product cut for putting those traces on the hop is LLM integration. We implement the hop as engineering. This post is what to measure. No invented dashboard product. No fake MTTR.
If you cannot answer what it said to one user at 14:12, you cannot tune, you cannot audit, and you cannot page the right owner.
Trace one request, not a vibe
Borrow the discipline you already have for services. One request id. Child spans for retrieval, each tool, the model call, the write.
Minimum fields on the root:
- App, user or service, route, model pin, prompt version.
- Data class declared or inferred.
- Deny or redaction events.
- Tokens and estimated dollars.
- Outcome if you have it: accepted, edited, abandoned, written back.
Yes/no:
- You can join a ticket id to the model trace.
- You can see a tool payload without opening three systems.
- On-call can find the trace without a vendor login.
If the only store is the provider's UI, you will lose history when the contract changes. Export to the same place you send app logs, at the right data class. "Log everything" that copies customer files into a debug bucket is a leak, not a win.
Measure quality, not only uptime
HTTP 200 on a fluent wrong answer is a successful failure. Observability has to include eval and human outcomes, not only latency.
Useful signals:
- Eval score on the last promote, attached to the prompt version.
- Live thumbs, edits, or reopens on the ticket the model touched.
- Retrieval miss rate, citation present rate, refuse-on-miss rate.
- Write propose versus write commit. A lot of proposes and no commits is a UX problem. Commits without proposes is a bypass.
You do not need a science platform. You need a few counters next to the inventory row. Drift is MEASURE in NIST language. If the score falls and nobody is paged, you have a dashboard for archaeology.
Cost and denies are first-class events
A retry loop is an incident. A burst of redaction events is an incident. A sudden move to a more expensive model is a change you should see the same day.
Alert on:
- Spend or tokens above the app cap.
- Error rate or timeout rate on the hop.
- Deny spikes (people trying to send a blocked class).
- Tool-result size exploding (context stuffing).
Do not alert on every completion. You will mute it. Cost management and observability share the same stamps. If finance and on-call look at different numbers, one of you is wrong.
Privacy bounds the trace
Observability that stores raw prompts for every user is a second CRM. Decide retention by tier. High-risk traces: shorter, tighter ACL, maybe redacted bodies. Low-risk internal drafts: you can keep more, still not forever.
- Admin browse of other people's prompts is off by default.
- Debug access is gated and logged.
- Production traces do not go to a personal laptop exporter.
If legal asks for a user's data, you should know which stores hold prompt text. If you cannot list those stores, stop adding exporters.
Operationalize on the same cadence as the inventory
Weekly: top traces that failed eval or were edited heavily. Monthly: whether new apps emit the same fields. When you add a tool server, add its span on day one.
Yes/no:
- A new app cannot ship to prod without the request id field.
- Someone owns the observability pipeline besides "the AI person."
- You have run a drill: reconstruct a bad answer from last Tuesday.
Without that drill, you have charts. With it, you have operations.
If the only graph you have is the invoice, you are not observing AI. You are paying for it. If you want the hop and the traces in your environment, talk to an engineer.
